Welcome Grafana Alloy!
Big news in the observability space! Loki Promtail is being phased out, and Grafana Alloy is stepping up as the new standard observability agent.
So, What is Grafana Alloy? 🤔
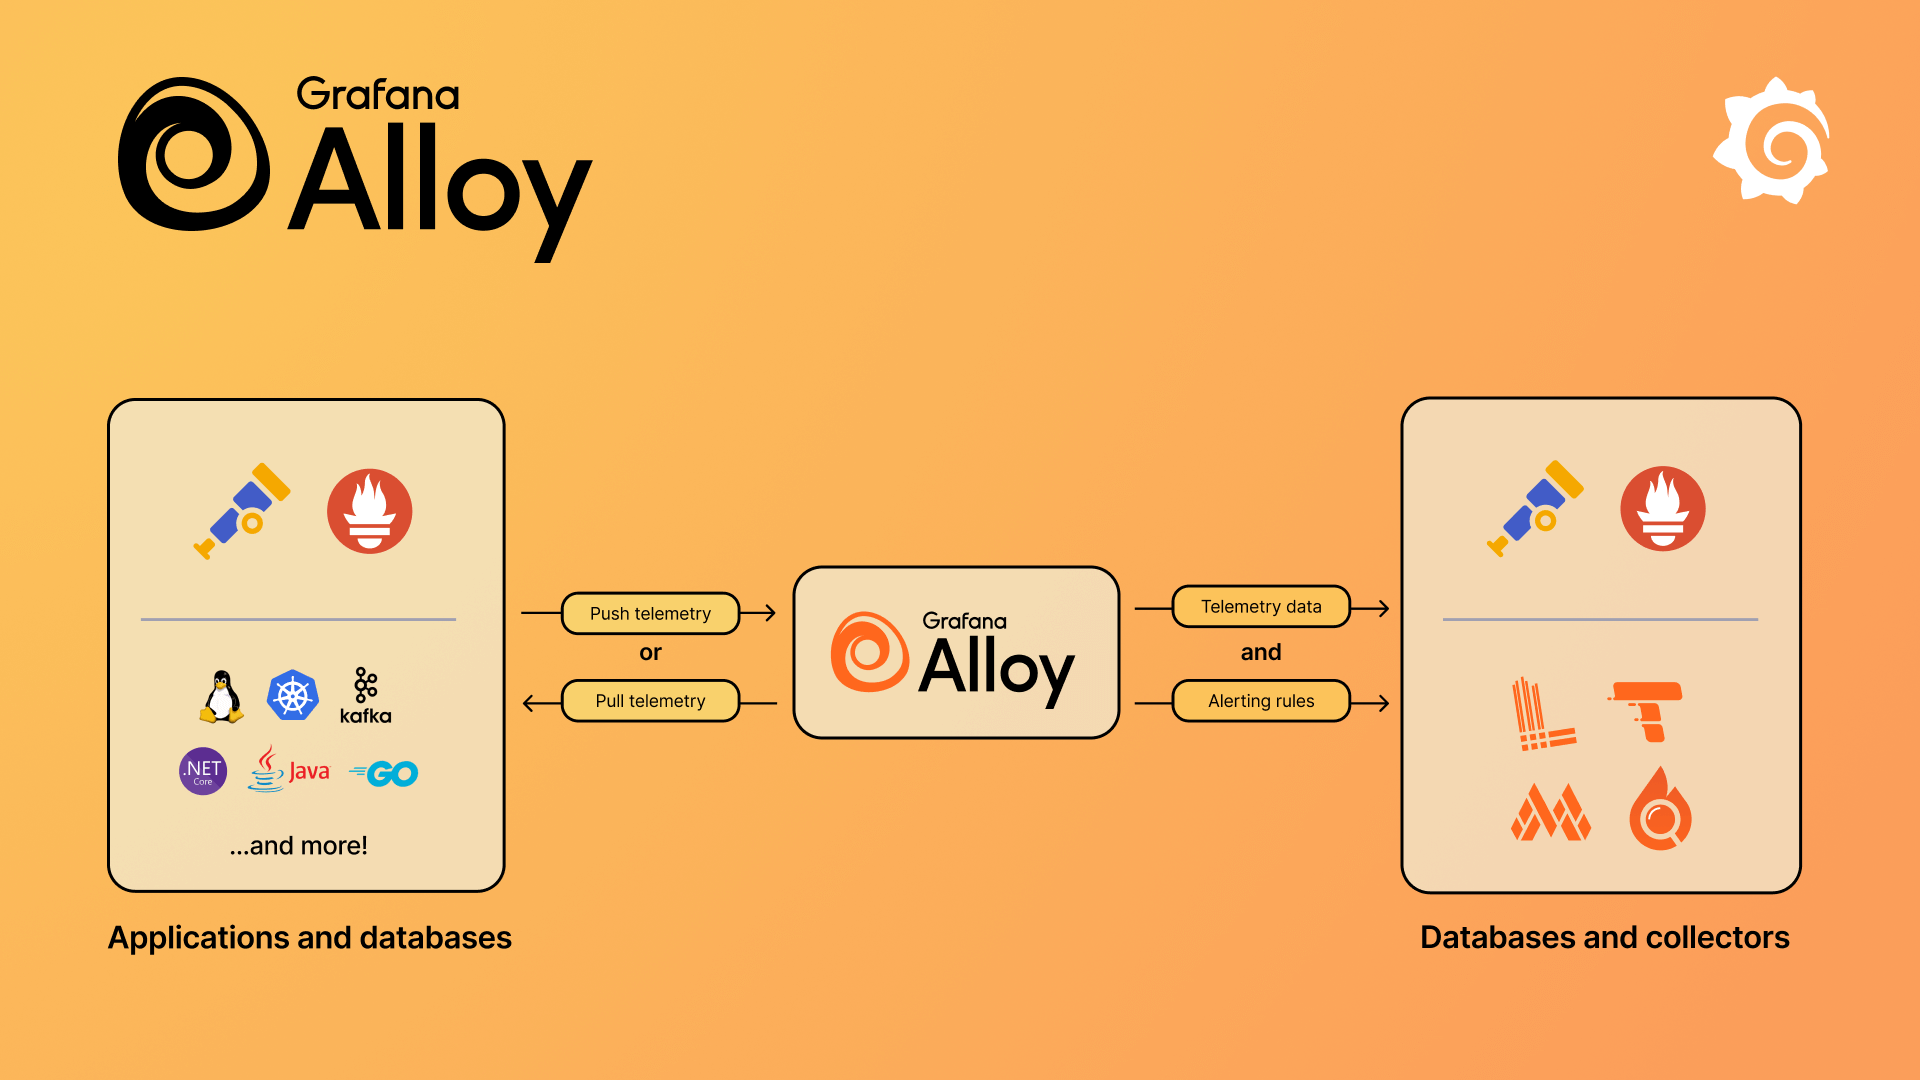
Grafana Alloy is an open-source, all-in-one telemetry agent developed by Grafana Labs. It streamlines observability by allowing you to collect logs, metrics, and traces in one place—without needing multiple agents.
Why the Shift?
Traditionally, users had to run separate agents to collect and send telemetry data:
- Prometheus Node Exporter → Collects system metrics
- Loki Promtail → Handles log forwarding
- OpenTelemetry Collector → Captures and exports tracing data
This approach worked but introduced complexity—more agents = more overhead and maintenance.
How Grafana Alloy Solves This Problem
Grafana Alloy combines all these functionalities into a single, lightweight agent, reducing deployment complexity while offering:
✅ A single agent for logs, metrics, and traces
✅ Custom processing pipelines for data transformation
✅ Broad compatibility with Grafana, Loki, Prometheus, OpenTelemetry, and other tools
✅ Efficient resource usage with fewer agents to manage
Example Use Case
Before Alloy, you needed:
🔹 Prometheus Node Exporter for metrics
🔹 Promtail for logs
🔹 OpenTelemetry Collector for traces
With Grafana Alloy, all of this can now be managed using just one agent! 🎯
How the Architecture Changes with Alloy
Here’s a simple diagram to illustrate the difference:
Before: Multiple Agents Handling Different Data Types
+------------------+      +--------------------+
| Node Exporter   | -->  | Prometheus Server  |
+------------------+      +--------------------+

+------------------+      +------------------+      +--------------+
| Promtail        | -->  | Loki             | ---> | Grafana UI  |
+------------------+      +------------------+      +--------------+

+------------------------+      +------------------+
| OpenTelemetry Collector | --> | Distributed Tracing |
+------------------------+      +------------------+
After: A Unified Solution with Grafana Alloy
+------------------------+
|  Grafana Alloy        |
|  (Metrics, Logs, Traces) |
+------------------------+
          |
          v
+------------------+
| Grafana, Loki,  |
| Prometheus, etc. |
+------------------+
Final Thoughts
Grafana Alloy simplifies observability by merging multiple agents into a single tool, making it easier to manage infrastructure monitoring. If you’re currently using Promtail, it’s time to start planning your migration to Alloy!
👉 Have you tried Grafana Alloy yet? What are your thoughts? Let’s discuss in the comments! ⬇️
Nice One